Secchi Dip-In Annual Reports
The Transparency of North American Volunteer-Monitored Waterbodies, 1994-2010
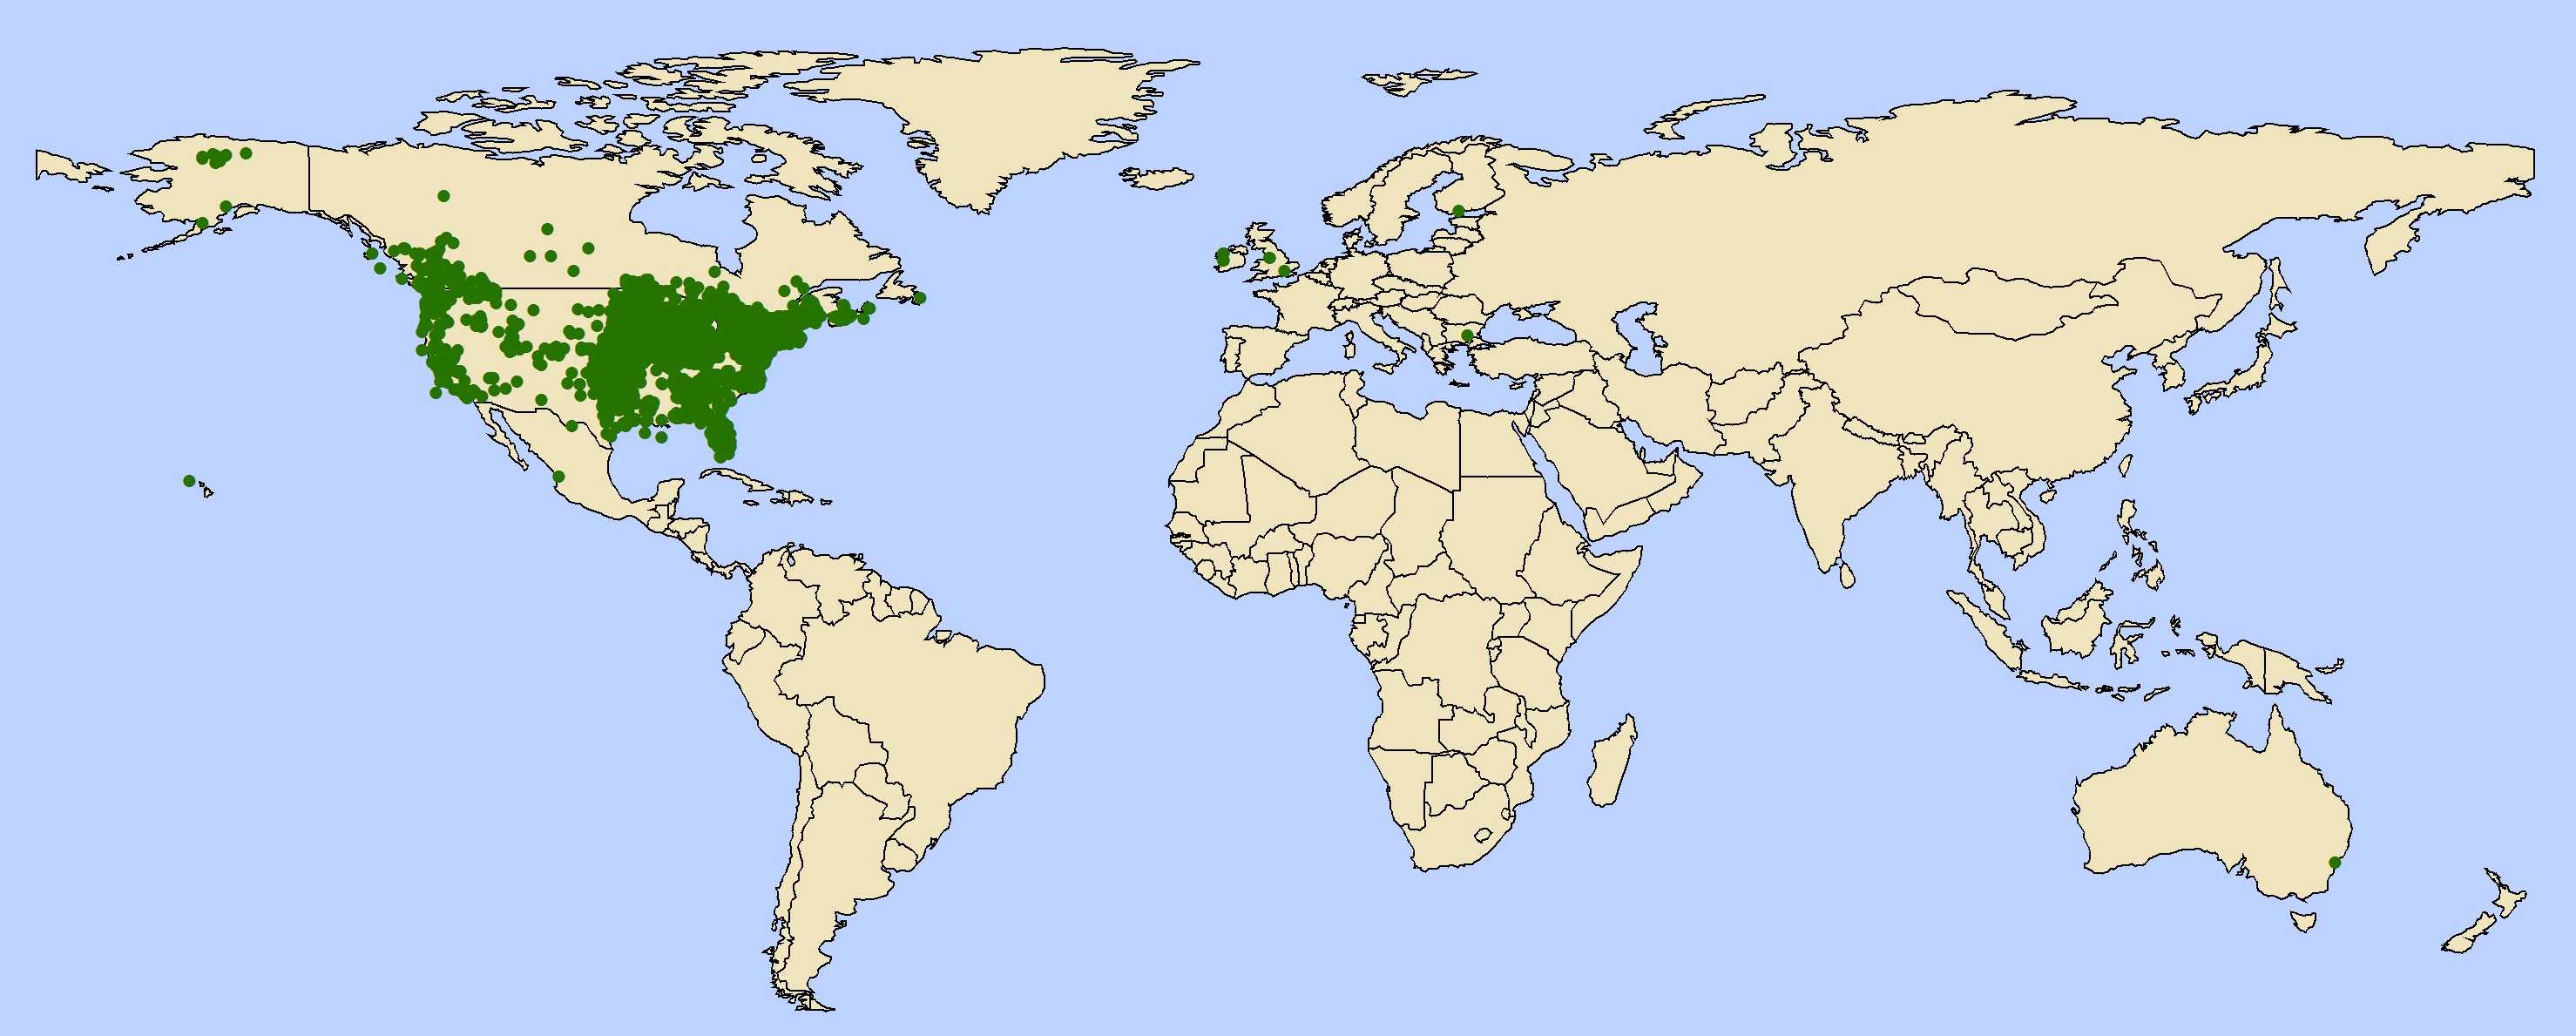
Most, but not all of the Dip-In’s 41,000 records have been submitted from North America. Even within North America, the distribution of data is uneven. It is thought this is the result of lack of participating monitoring programs in these regions and perhaps a scarcity of waterbodies.
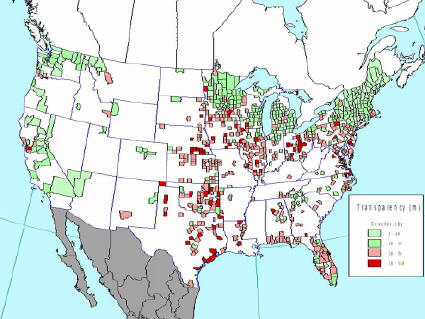
The Dip-In database has been combined with one from the University of Florida, resulting in information on more than 13,000 waterbodies. This density of information gives us a better view of the regional distribution of transparency in North America.
Notice the concentration of waterbodies of greater transparency in the northern tier of the US and in Canada. The agricultural heartland of the continent tends to have smaller transparencies, in part because of the fertile soils that make agriculture possible, agricultural practices, and the predominance of reservoirs rather than lakes.
Transparency Trends
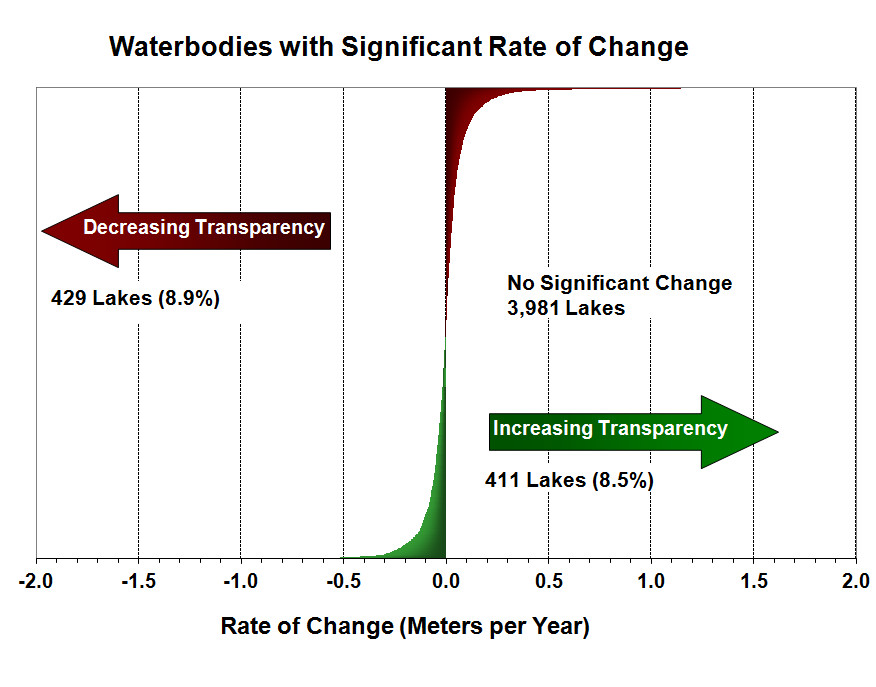 By 2010, 2,019 waterbodies had 5 or more years of data. When the University of Florida data are added, the number jumps to 4,800 waterbodies. Of these, 17% had significant changes in transparency; 9% had significant decreases in transparency and 8% had significant increases. Regional patterns related to land use might explain which lakes exhibited change.


