by Laurie Sovell, Minnesota Pollution Control Agency
 |
Introduction
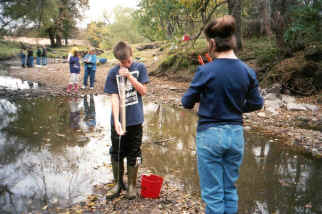
The Minnesota Pollution Control Agency (MPCA) offered a Citizen Stream-Monitoring Program (CSMP) for the first time during 1998. The CSMP was designed to give individuals across Minnesota an opportunity for involvement in a simple, yet meaningful stream-monitoring program that provides interpretation and data management statewide. CSMP volunteers completed their first full monitoring season during 1999. The program experienced a tremendous expansion, from 17 volunteers and 22 sites during the 1998 pilot season to 143 volunteers and 177 sites in 1999. The CSMP uses a collaborative approach to stream monitoring by partnering with citizen volunteers who live on or near a stream and are interested in water quality. Volunteers receive a transparency tube, rain gauge, data sheets, and instructions for taking measurements. Once a week from April to September volunteers visit an established spot on a nearby stream and record stream transparency, stage, appearance and recreational suitability. In addition to weekly stream measurements, rainfall is recorded daily. Volunteers are encouraged to monitor immediately after large rainfall events whenever possible to track the effects of rainfall runoff on their stream.
Index
The Nature of Stream Water Transparency
Putting the Transparency Tube to Work in Minnesota’s CSMP
The Relationship between Transparency and Turbidity
The Transparency Tube
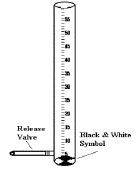
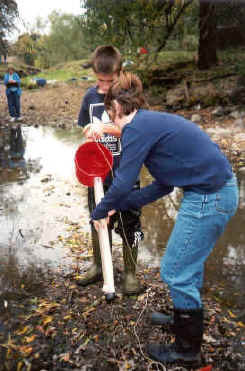
The transparency tube is a key feature of the CSMP. It was developed in Australia as a tool for measuring stream water clarity, which serves as a basic indicator of water quality. The tube is 2 feet long x 1½-inch wide, made of clear plastic, and has a release valve at the bottom. A stopper inserted at one end of the tube is painted black and white, so that when you look down into the tube a distinct “Secchi” symbol is visible at the bottom. To measure water clarity, the tube is filled with water collected from a stream or river. Looking down into the tube, water is released through the valve until the black and white symbol is visible. The depth of the water when the symbol becomes visible is recorded in centimeters, which are marked on the side of the tube. If the symbol is visible when the tube is full, the transparency reading is “>60 centimeters.” A greater transparency reading in centimeters reflects higher water clarity.
The Nature of Stream Water Transparency
Transparency of water is affected by a number of factors. Both dissolved and suspended materials can influence water transparency. For most water bodies, the amount of solids suspended in the water is the most important factor: the more suspended materials, the lower the water transparency. In lakes, the majority of suspended solids are algae.
In streams and rivers, soil particles (predominantly silts and clays) are a more important influence on transparency as water flows downstream, carrying and depositing sediment with it. A good example of dissolved material that affects transparency is the tea color of some northern, bog-influenced lakes and streams, which is caused by dissolved organic material.
Tracking water transparency, like monitoring your blood pressure on a regular basis, tells us about the general health of a stream. First, changes in transparency can tell us when key water pollutants are present.
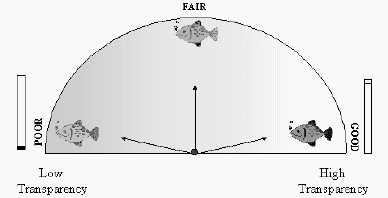
In general, a low transparency reading reflects a large amount of sediment (excessive soil material) or other suspended material like algae in the water. Excess soil material is a significant pollutant itself, whether it is suspended in the water column or deposited as sediment on stream bottoms. Suspended sediment reduces light penetration needed for the growth of beneficial aquatic plants. It also interferes with the ability of fish to see and capture their prey (Figure 1). When sediment is deposited on stream bottoms it can smother fish eggs, keeping them from getting the oxygen needed to survive. Deposited sediment clogs spaces between rocks where insects like to live in streams. This in turn can lead to fewer fish that depend on insects as food. Finally, sediment may have pollutants attached to it such as phosphorous and petroleum products. These pollutants degrade the quality of flowing water, as well as downstream lakes or reservoirs.
Transparency is also a meaningful measure of water quality because people can see it change, and easily understand how it reflects stream condition. A citizen once described his long-term goal for a river in these terms: “I want to be able to see my toes when I’m standing knee-deep in the water.”High algae concentrations, which also reduce transparency, are most likely to occur in large rivers with high nutrient concentrations at low flow. Algae contribute dissolved oxygen to the river through the process of photosynthesis while they are living, but deplete oxygen when they die and decompose in the bottom of the river.
Putting the Transparency Tube to Work in Minnesota’s CSMP
Data collected by volunteers can help identify water-quality problems, prioritize areas for additional research, and track progress toward improvement. Volunteer data may be useful for a variety of monitoring approaches including:
- Screening a watershed to determine which areas might be the primary source of pollution
- Long-term tracking of water quality in a particular stream
- Observing how water quality changes seasonally and in response to precipitation
- Upstream-downstream monitoring (e.g., above and below a wetland or construction site)
- Monitoring urban runoff generated by precipitation or snowmelt.
Many people are already putting CSMP data to work. Residents of Chisago and Dodge Counties are helping determine the condition of their streams by monitoring as CSMP volunteers. Staff in these counties recruited citizens to monitor specific watersheds of interest within their borders. Watershed projects have also enrolled in the CSMP as a tool to involve residents and collect valuable, basic water quality data. Some examples of participating watershed projects include Chub Creek in Dakota and Rice Counties, the Mille Lacs Lake Watershed Project, the South Zumbro River Watershed Partnership in Olmsted County, and the South Branch Root River project in Fillmore County. In each of these instances, county or local resource agency staff provides critical local support and guidance to CSMP volunteers.
In Todd and Stearns County, the Big Birch Lake Association is using CSMP data collected by their members to guide the implementation of a stream buffer program along Fish Creek, a tributary to the lake. We are excited to see the CSMP become a useful and integrated part of local, water resource protection efforts throughout Minnesota.
The Relationship between Transparency and Turbidity
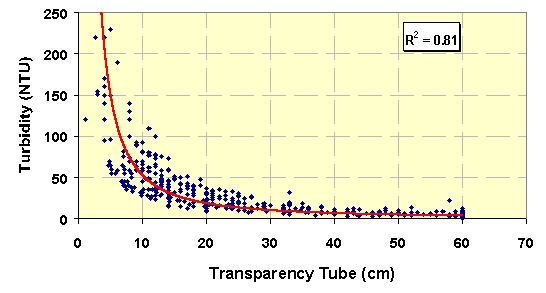
Transparency is related to another water quality characteristic that professionals normally monitor, known as turbidity. Turbidity describes how suspended particles affect water transparency. Turbidity does not actually measure the concentration of materials in water, but their scattering and shadowing effect on light shining through the water. The 1998 CSMP report described how low transparency readings correspond to high turbidity (Figure 2). This relationship suggests the potential to predict stream turbidity based on transparency-tube measurements. It is important because in Minnesota we have a water-quality “standard” or limit for turbidity of 25 units for most streams and rivers.
If turbidity is consistently above this 25-unit standard, we consider the stream “impaired” because high turbidity can interfere with fish behavior and other stream processes. If we can fine-tune our understanding of the relationship between transparency and turbidity, transparency may be used as a simple meter for identifying exceedances of the turbidity standard, or turbidity impairments.
During 1999, we took a closer look at this relationship by pulling together all of the data we have collected for these two measures to date. The results are shown in Figure 2. We found more evidence supporting the idea that transparency may be a simple indicator of turbidity. As transparency declines, turbidity increases with a marked increase as transparency declines to around 20-30 cm.
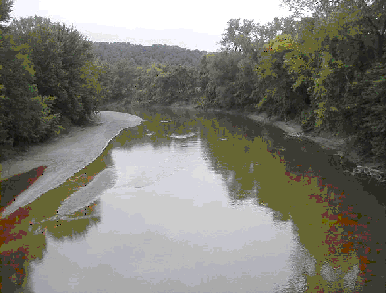
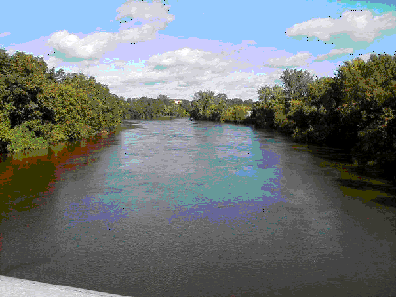
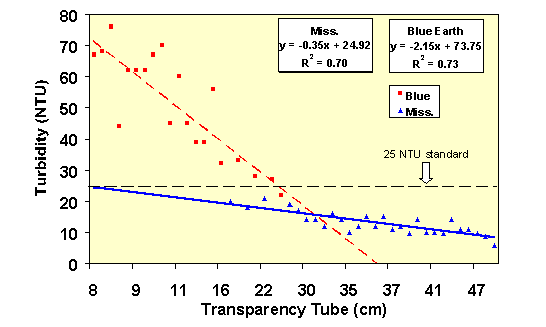
For transparencies below about 20 cm, there is quite a bit of variability in the corresponding turbidity value. For example, at a transparency of 8 cm, we observed one turbidity reading of 40 on the Minnesota River, and another reading of 140 on the Cottonwood River. What causes such a large difference in turbidity for a given transparency reading? We decided to look at this relationship at sites along two rivers to try to gain a better understanding. Figure 5 provides a comparison of the transparency and turbidity relationship between the Blue Earth and Mississippi Rivers. The Blue Earth drains a highly agricultural watershed and the study area of the Mississippi is predominantly forested (Figures 3-4). Blue Earth River turbidity readings are high, ranging from 22 to 78 NTUs and transparency tube values low, ranging from 25 to 8 cm. For Mississippi River sites turbidity values are low, ranging from about 5 to 20 NTUs and transparency tube values range from 50 to 17 cm. The variability in turbidity is much higher for the Blue Earth River (Figure 5).
This variability suggests the need to examine the relationship in additional rivers to increase our understanding of which factors may influence transparency measurements, rather than simply relying on statewide relationships as depicted in Figure 2.
Other References on the Transparency Tube
http://www.epa.gov/owow/monitoring/volunteer/stream/vms55.html
For more information about the use of the transparency tube in Minnesota, contact:
Laurie Sovell
Coordinator, Citizen Stream-Monitoring Program
Minnesota Pollution Control Agency
520 Lafayette Rd. N.
St. Paul, MN 55155
651-296-7187
laurie.sovell@pca.state.mn.us
www.pca.state.mn.us/water/csmp.html


